Investigation of Parametric Curves
by
Nathan Wisdom
We want to investigate the parametric equations:
for
0≤
t ≤50
When a and b = 1 we get the following graph
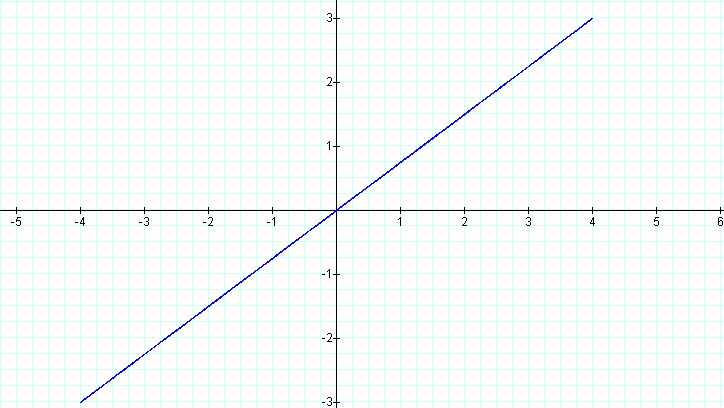 Fig 1
Fig 1
This is a surprising result, because I did not expect to get
a straight line with these parametric curves.
Is it possible to obtain other
well known curves, for instance parabola, ellipse, etc? What values of
a and b would produce such curves?
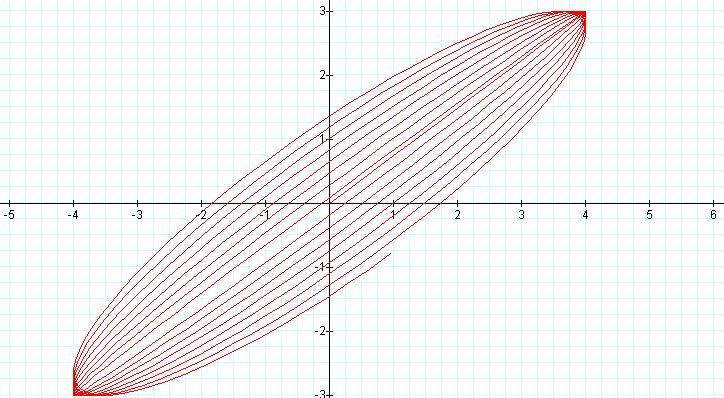
We now look at the graph for a/b =1/2, 1/4, 2/3, 12/13 etc.
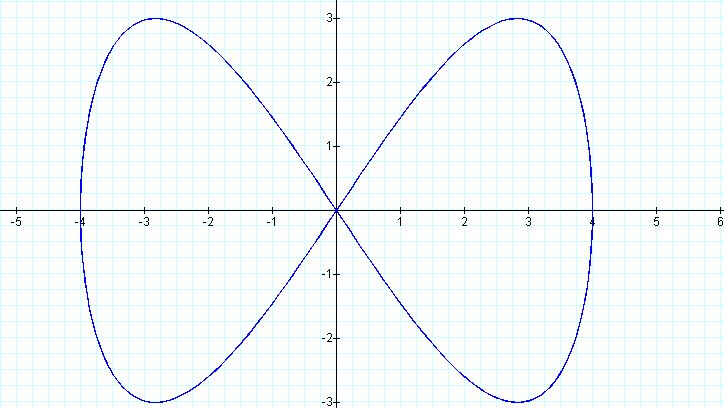 Fig 2. a =1, b =2
Note that you get a boa tie
loop with amplitude 3. Note also the graph is bounded by a rectangle.
We see that there are two peaks at the top and two peaks at the bottom. Also there is one knot, which is located at (0,0)
We see that there are two peaks at the top and two peaks at the bottom. Also there is one knot, which is located at (0,0)
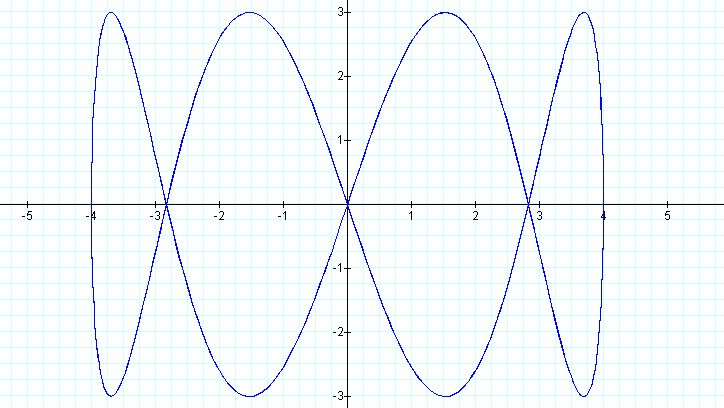 Fig 3. a=1, b=4
In Fig 3. We note when b
= 4 there are four peaks and three knots. The curve is still bounded by
the same rectangle.
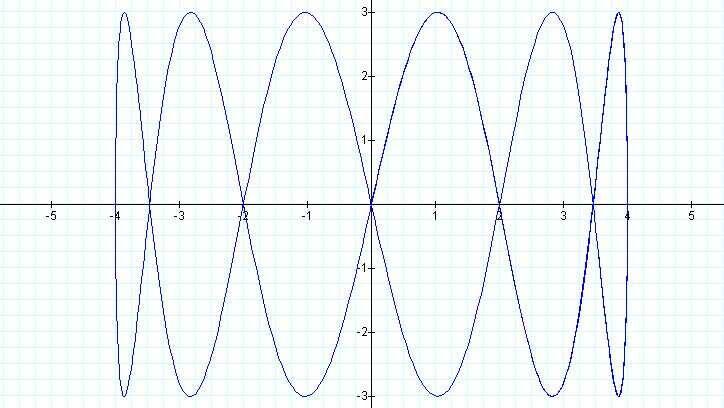 Fig 4. a=1, b =6
When b = 6 we
have 6 peaks and 5 knots. The curve is closed
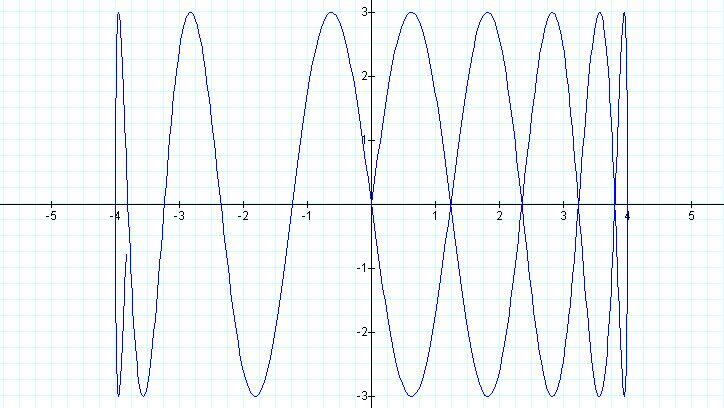 Fig 5. a=1, b= 10
Note the loops are not closed
any more b = 10, and the right hand side of the graph is now
compressed. Also there are no knots on the left hand side of the curve.
Now look at another set of graphs
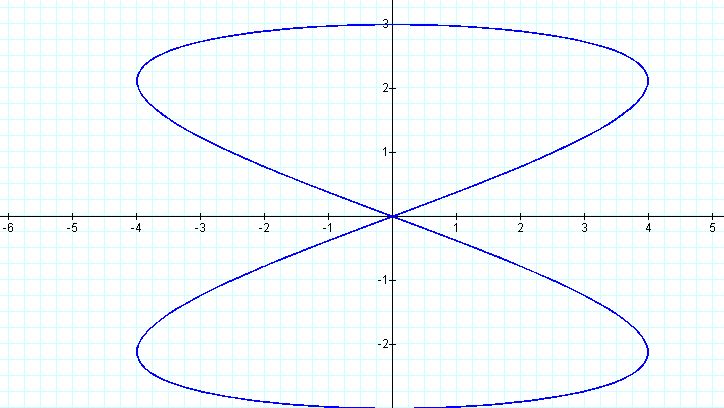 Fig. 6 a=2 b=1
Compare Fig6 with Fig 2. Is this a simple transformation?
Note the graph is bounded by
3, -3 on the y-axis and 4, -4 on the x- axis.
It is evident that the number of loops is determined by a. Look at the graph when a = 6 and b =1.
It is evident that the number of loops is determined by a. Look at the graph when a = 6 and b =1.
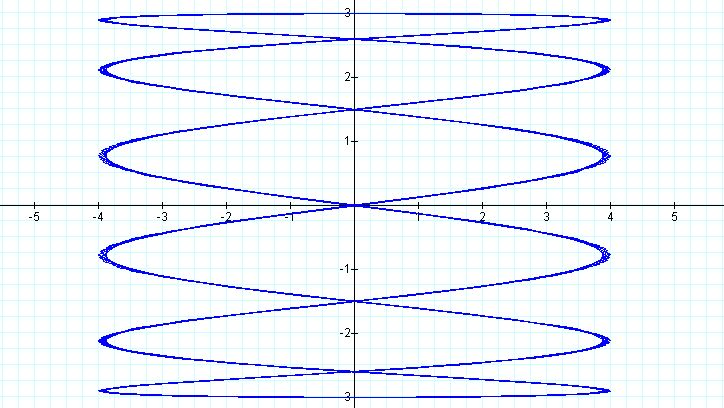 Fig. 7 a=6, b=1
We now look at the curve for
which a= 2 and b =3 (Fig 8). We have have 2 peaks left and right and
three peaks top and bottom. The knots appear to have a simple
relationship with a, and b. There are three knots on the x-axis, 2
knots above and 2 below.
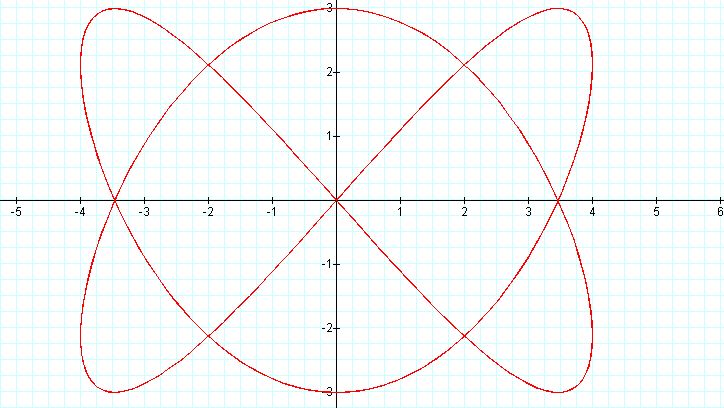 Fig 8. a=2, b=3
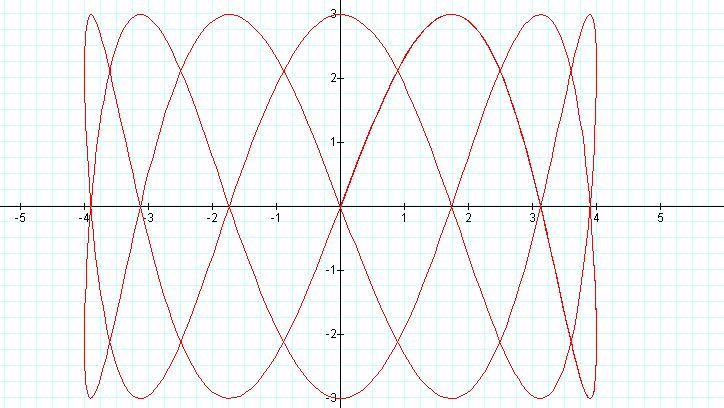 Fig.9 a=2, b=7
Again the peaks are consistent but the knots are complex.
Here is another curve. Is this
a single transformation?
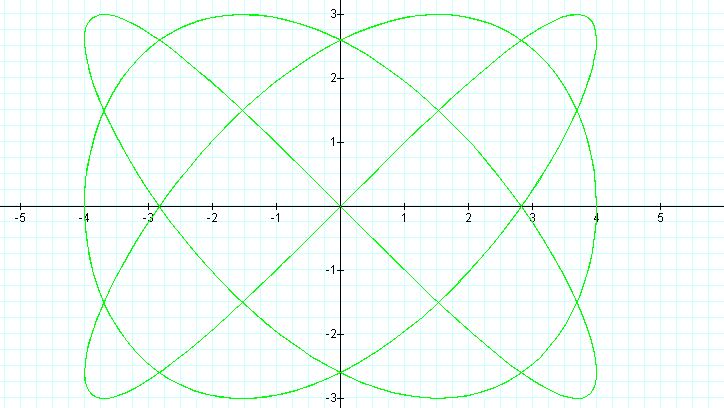 Fig 10 a=3, b=2
Compare Fig10 with Fig 8.
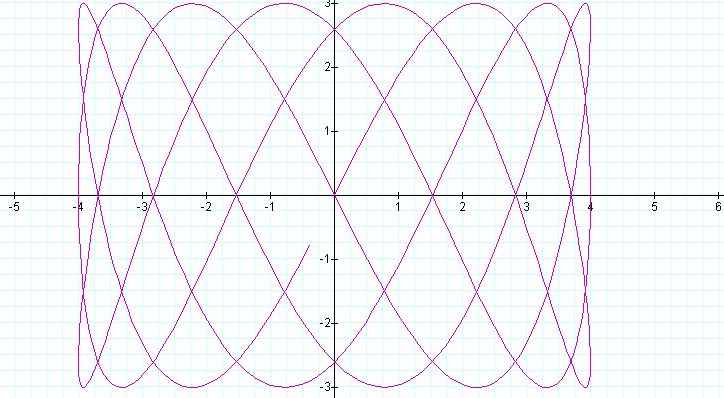 Fig 11 a=3, b=4Fig 12. a=3, b=8
Fig 13 a=4, b=7
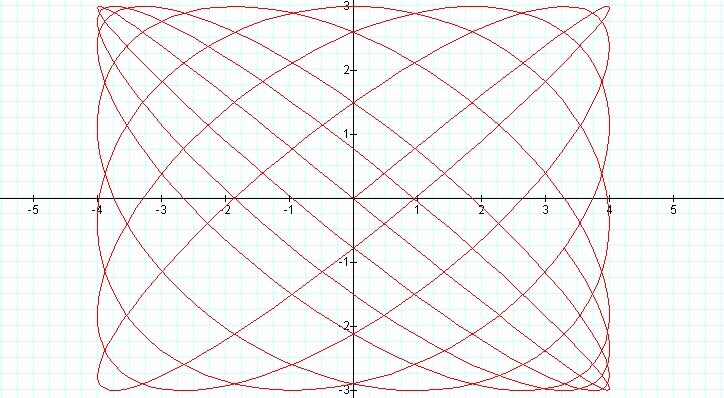 Fig 14 a=12, b=13
This class of parametric
curves are called Lissajous curves. Note that they are all bounded by a
rectangle of dimension 2a by 2b.
These curves have significant application in Physics and Particle Mechanics.
We now compare the graphs with the equation:

We note the same set of graphs bounded by the unit square.
These curves have significant application in Physics and Particle Mechanics.
We now compare the graphs with the equation:
We note the same set of graphs bounded by the unit square.
What values of a and b would produce this graph?
Or This?
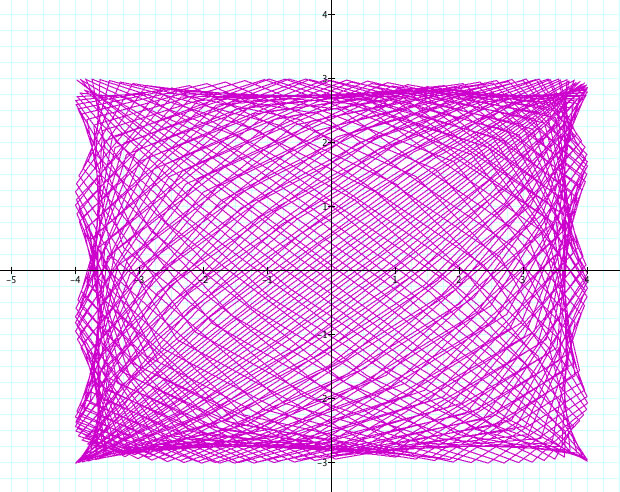
Here is a real Challenge. How might this graph be formed?